
Page 28 - Vol.14
P. 28
Tech
Notes
技術專文
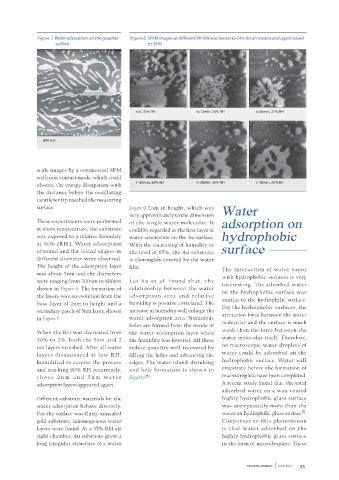
Figure 3. Wafer light point defects map of time-dependent haze Figure 4. The trend chart of the wafer defect size Figure 7. Water adsorption on the graphite Figure 8. SPFM images at different RH (RH was lowed to 24% for an instant and again raised
surface to 35%)
Composite 100
Defects, Areas
80
18 month
storage
60 UCL
Change in >= 0.12 mciron LPDs 20 CL t=0, 33% RH t=12min, 24% RH t=16min, 27% RH
40
0
-20
-40 800 nm
LCL
-60
Defects 1/20/97 8/8/97 2/24/98 9/12/98 3/31/99
(Composite) Manufacturing Date
CL = 2.0 UCL = 48.9 LCL = -44.8 scale images by a commercial SFM
with non-contact mode, which could
t=20min, 29% RH t=30min, 35% RH t=38min, 35% RH
observe the energy dissipation with
Figure5. The area of a wafer affected by the time dependent haze Figure 6. Water adsorption at 90%RH the distance before the oscillating
(TDH) versus water volume
cantilever tip touched the measuring
surface. layer 0.2nm in height, which was
Slot No. 1 7 13 19 25 Water
very approximately to the dimension
240μL These experiments were performed of the single water molecular. It adsorption on
at room temperature; the substrate
could be regarded as the first layer of
was exposed to a relative humidity water adsorption on the Au surface. hydrophobic
480μL at 90% (RH.). Water adsorption With the increasing of humidity to
the level of 65%, the Au substrate surface
of round and flat island shapes in
different diameter were observed. is thoroughly covered by the water
(I=4, P=0) The height of the adsorption layer fi lm.
960μL was about 5nm and the diameters The interaction of water vapor
were ranging from 300nm to 600nm L e i Xu et a l. fou nd t h at, t he with hydrophobic surfaces is very
Water volume interesting. The adsorbed water
shown in Figure 6. The formation of relationship between the water on the hydrophobic surface was
the layers was an evolution from the ad sor ption are a and re l ative
base layer of 2nm in height and a humidity is positive correlated. The similar to the hydrophilic surface.
For the hydrophobic surfaces, the
secondary patch of 5nm layer, shown increase in humidity will enlarge the
Figure 4. It is clear that storage time organic molecules to be deposited. Water in Figure 7. water adsorption area. Numerous attraction force between the water
increment leads no impact to the holes are formed from the inside of molecular and the surface is much
surface particle numbers. The area of a wafer affected by adsorption on When the RH was decreased from the water adsorption layer when weak than the force between the
the time dependent haze could be 90% to 2%, both the 5nm and 2 the humidity was lowered. All these water molecular itself. Therefore,
An accelerated degradation test expressed as a function of water hydrophilic nm layers vanished. After all water reduce quantity will recovered by no macroscopic water droplets of
was also performed. One milliliter volume added to the wafer package layers disappeared at low RH, filling the holes and advancing the water could be adsorbed on the
water was added into the wafer shown as Figure 5. surface humidified to reverse the process edges. The water island shrinking hydrophobic surface. Water will
and then packed into the box. The and reaching 90% RH recurrently, and hole formation is shown in evaporate before the formation of
package was unboxed after 4 hours t h o s e 2 n m a n d 5 n m w a te r Figure 8 . macrodroplets have been completed.
[4]
and 16 hours respectively. The The adsorption of water on surfaces adsorption layers appeared again. A recent study found that, the total
relative humidity was held at a level in ambient conditions is the main adsorbed water on a wax-coated
of about 90%. The main purpose phenomena for oxidation, catalysis Different substrate materials for the highly hydrophobic glass surface
of the accelerated degradation test and lubrication. The adsorption water adsorption behave diversely. was unexpectedly more than the
[5]
was to apply water as agent creating layer of water is on an extremely For the surface was flame-annealed water on hydrophilic glass surface .
extre mely h ig h cont am in ant microscopic scale in dimension. A gold substrate, inhomogenous water Conjecture to this phenomenon
concentration. Firstly, favor the former study performed a series of layers were found. At a 35% RH air is that water adsorbed on the
formation of the water soluble water adsorption measurements on tight chamber, Au substrate grew a highly hydrophobic glass surface
ion. Secondly, assist water soluble a graphite surface, taking nanometer long irregular structure of a water in the form of microdroplets. These
24 NEW FAB JOURNAL JUNE 2014 25