
Page 13 - Vol.10
P. 13
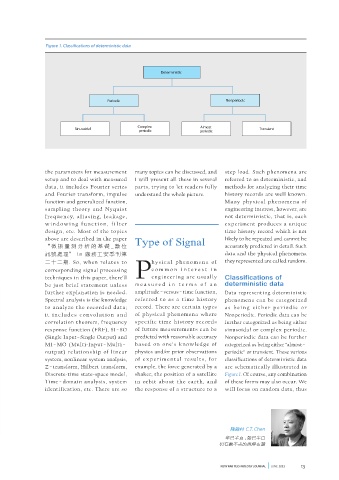
Figure 1. Classifications of deterministic data


                                                          Deterministic


 & Spectral                            Periodic                                 Nonperiodic


                                                 Complex               Almost
                           Sinusoidal             periodic             periodic             Transient


                 the parameters for measurement   many topics can be discussed, and   step load. Such phenomena are
                 setup and to deal with measured   I will present all these in several   referred to as deterministic, and
                 data, it includes Fourier series   parts, trying to let readers fully   methods for analyzing their time
                 and Fourier transform, impulse   understand the whole picture.  history records are well known.
                 function and generalized function,                             Many  physical  phenomena  of
                 sampling theory and Nyquist                                    engineering interest, however, are
                 frequency, a l iasing, leakage,                                not deterministic, that is, each
                 w i nd ow i n g f u nct ion , f i lt e r                       experiment  produces a  unique
                 design, etc. Most of the topics                                time history record which is not
                 above are described in the paper   Type of Signal              likely to be repeated and cannot be
                 “ 微振量測分析的基礎_數位                                                 accurately predicted in detail. Such
                 訊號處理” in  廠務工安季刊第                                              data and the physical phenomena
                 二十二期. So, when relates to            hy s ic a l  phenomen a  o f   they represented are called random.
                 corresponding signal processing      c o m mon  i n t e r e s t  i n
                 techniques in this paper, there’ll  Pengineering are usually   Classifications of
                 be just brief statement unless   m e a s u r e d  i n  t e r m s  o f  a n   deterministic data
                 further explanation is needed.   amplitude– versus– time function,   Data representing deterministic
                 Spectral analysis is the knowledge   referred to as a time histor y   phenomena can be categorized
                 to analyze the recorded data;   record. There are certain types   a s  b e i n g e i t h e r  p e r i o d i c  o r
                 it i nc lud e s convolut ion a nd   of physical phenomena where   Nonperiodic. Periodic data can be
                 correlation theorem, frequency   specific time history records   further categorized as being either
                 response function (FRF), SI –SO   of future measurements can be   sinusoidal or complex periodic.
                 (Single Input – Single Output) and   predicted with reasonable accuracy   Nonperiodic data can be further
                 MI–MO (Multi-Input –Multi–     based  on  one’s  knowledge  of   categorized as being either “almost –
                 output) relationship of linear   physics and/or prior observations   periodic” or transient. These various
                 system, nonlinear system analysis,   of e x per i menta l resu lts, for   classifications of deterministic data
                 Z –transform, Hilbert transform,   example, the force generated by a   are schematically  illustrated in
                 Discrete-time state-space model,   shaker, the position of a satellite   Figure 1. Of course, any combination
                 Time–domain analysis, system   in orbit about the earth, and   of these forms may also occur. We
                 identification, etc. There are so   the response of a structure to a   will focus on random data, thus


                                                                                  陳錦村 C.T. Chen

                                                                                年已半百 , 髮已半白
                                                                              仍有數不盡的挑燈夜讀


                                                                              NEW FAB TECHNOLOGY JOURNAL         JUNE  2013  13