Page 74 - Vol.13
P. 74

New
             Vision
             新象新知


                   Revenue Unit : M USD
                          Applied Materials              Lam Research                 Tokyo Electron
                  12,000                       12,000                       12,000
                  10,000                       10,000                       10,000
                  8,000                        8,000                         8,000
                  6,000                        6,000                         6,000
                  4,000                        4,000                         4,000
                  2,000                        2,000                         2,000
                   0                             0                            0
                     1999 2000 2001 2002 2003 2004 2005 2006 2007 2008 2009 2010 2011 2012  1999 2000 2001 2002 2003 2004 2005 2006 2007 2008 2009 2010 2011 2012  1999 2000 2001 2002 2003 2004 2005 2006 2007 2008 2009 2010 2011 2012
                   Net Margin Unit : %
                           Applied Materials             Lam Research                 Tokyo Electron
                  30%                          30%                           30%
                  20%                          20%                           20%
                  10%                          10%                           10%
                  0%                            0%                           0%
                    1999 2000 2001 2002 2003 2004 2005 2006 2007 2008 2009 2010 2011 2012  1999 2000 2001 2002 2003 2004 2005 2006 2007 2008 2009 2010 2011 2012  1999 2000 2001 2002 2003 2004 2005 2006 2007 2008 2009 2010 2011 2012
                  -10%                         -10%                         -10%
                  -20%                         -20%                         -20%
                  -30%                         -30%                         -30%

                   Revenue Unit : M USD
                              ASML                      Novellus Systems             ASM International
                  12,000                       12,000                       12,000
                  10,000                       10,000                       10,000
                  8,000                        8,000                         8,000
                  6,000                        6,000                         6,000
                  4,000                        4,000                         4,000
                  2,000                        2,000                         2,000
                   0                             0                            0
                     1999 2000 2001 2002 2003 2004 2005 2006 2007 2008 2009 2010 2011 2012  1999 2000 2001 2002 2003 2004 2005 2006 2007 2008 2009 2010 2011 2012  1999 2000 2001 2002 2003 2004 2005 2006 2007 2008 2009 2010 2011 2012
                   Net Margin Unit : %
                              ASML                      Novellus Systems             ASM International
                  30%                          30%                           30%
                  20%                          20%                           20%
                  10%                          10%                           10%
                  0%                            0%                           0%
                    1999 2000 2001 2002 2003 2004 2005 2006 2007 2008 2009 2010 2011 2012  1999 2000 2001 2002 2003 2004 2005 2006 2007 2008 2009 2010 2011 2012  1999 2000 2001 2002 2003 2004 2005 2006 2007 2008 2009 2010 2011 2012
                 -10%                          -10%                         -10%
                 -20%                          -20%                         -20%
                 -30%                          -30%
                                                                            -30%

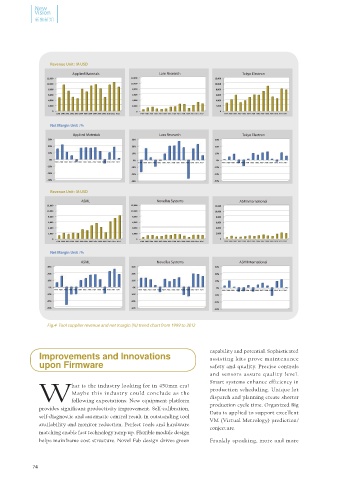
                  Fig.4  Tool supplier revenue and net margin (%) trend chart from 1999 to 2012


               Improvements and Innovations                                capability and potential. Sophisticated
                                                                           assisting kits prove maintenance
               upon Firmware                                               safety and quality. Precise controls
                                                                           and sensors assure quality level.
                                                                           Smart systems enhance efficiency in
                          hat is the industry looking for in 450mm era?
                          Maybe this industry could conclude as the        production scheduling. Unique lot
                                                                           dispatch and planning create shorter
               Wfollowing expectations: New equipment platform
                                                                           production cycle time. Organized Big
               provides significant productivity improvement. Self-calibration,
                                                                           Data is applied to support excellent
               self-diagnostic and automatic control result in outstanding tool
                                                                           VM (Virtual Metrology) prediction/
               availability and monitor reduction. Perfect tools and hardware
                                                                           conjecture.
               matching enable fast technology ramp up. Flexible module design
               helps mainframe cost structure. Novel Fab design drives green   Frankly speaking, more and more


            74
   69   70   71   72   73   74   75   76   77   78   79