摘要
應用模擬及分析技術於營建工程的資源分配及時程規畫
Keywords / Resource Arrangement,Schedule Planning,Simulation13,Primavera Project Planner,Microsoft Project

迄今為止,很少有文獻介紹在特定的工程目標及限制條件下,承包商如何找出人力、材料、設備及空間的最佳化分配。因此,傳統的資源分配及時程規畫方法往往相當依賴經驗或直覺判斷,而非依據實際數據做分析。本文作者應用模擬及分析技術,開發一營建工程的資源分配及時程規畫系統,幫助承包商依據實際數據分析,找出人力、材料、設備及空間的較佳化分配。因為此系統同時考慮及整合大部分的營建因素(如:時程、成本、空間、人力、設備及材料等),所以所得到分析結果會較接近最佳化。 此外,此系統可以讓承包商依據不同的假設狀況,瞭解各種不同狀況對工程所造成的可能衝擊,也可讓承包商在遇到突發狀況(如:變更設計、材料延誤送達工地等)時,在設定的工程目標及限制條件下,馬上依據系統建議做資源分配及時程規畫的調整,減少突發狀況對工程所造成的衝擊。本文也藉由一個範例,對此系統與兩個普遍被使用的商用軟體(Primavera Project Planner及Microsoft Project)做性能上的比較。
前言 Introduction
工程建設的尺寸越來越大,成本也越來越高,因此承包商需要藉助更完善的技術及工具幫助其做好營建管理的工作。在營建管理中,資源分配及時程規畫的好壞對工程的成敗有決定性的影響。
截至目前為止,已經有許多關於資源分配及時程規畫的研究被發表,這些研究主要嘗試解決下列問題:
- 在不同的工程目標(如:最低工程成本、最短工期等)及限制條件(如:工程完成期限、每天可使用的資源數量限制等)組合下,每一個工程項目較佳的資源(如:人力、設備及材料等)分配及時程規畫為何?
- 在配合工程目標的前提下,何者為各已分配資源之較佳空間分配?
- 達成工程目標的機率為何?
- 如果原先的工程時程規畫因為不可預知的突發狀況(如:變更設計、材料延誤送達工地等)而需修改,其對工程所造成的衝擊為何?
本研究即針對上述問題,提供另一個解決的方法。
文獻回顧 Background
傳統的資源分配方法主要包括數學方法及啟發式方法。然而,數學方法公式過於複雜,且有可能找到局部最佳解的風險【Li and Love1997; Hegazy 2002】。各種啟發式方法則在不同的情況下有不同的效果。因此,沒有一種啟發式方法可以適用於所有的情況。而且,我們無從得知在什麼情況下,我們應該使用哪一種啟發式方法。所以,使用啟發式方法無法保證找到最佳解。基於上述原因,使用商用軟體找到的資源分配結果常各不相同【Hegazy and El-Zamamzay 1998】。
最近這些年來,由於電腦科技的不斷快速發展,應用模擬技術模擬複雜營建過程的方法已經越來越受到重視【Sawhney et al. 1999】。
在空間分配的議題上,許多研究使用啟發式方法、數學方法及遺傳算法來求解靜態空間規畫問題【例如: Warszawski and Peer 1973; Rodriguez-Ramos 1982; Hamiani 1987; Tommelein 1989; Tommelein et al. 1991; Yeh 1995;Hegazy and Elbeltagi 1999; Mawdesley et al. 2002; Zouein et al. 2002; Cheung et al. 2002; Tam et al. 2001; Osman et al. 2003a; Khalafallah and El-Rayes 2005, 2006】。在營建過程中,不論永久設施或暫時設施,這些方法都是使用靜態的方式做空間分配,忽略了同一空間在不同時間可以讓不同的暫時設施使用。
隨工程的進行,空間的規畫也隨著變化,則被稱為動態空間規畫。動態空間規劃的問題,最近已被注意到【Smith 1987; Tommelein 1991】。現在有其它替代方法來解決動態空間規劃的問題。在生產設施方面,Rosenblatt (1986)、Montreuil and Venkatadri (1991)依據設施不能重疊的原則,提供不同的解決動態設施空間規劃問題方法。解決這類問題的最佳方法是NP-complete,但是NP-complete只有在小規模或限制條件較多時才能得到精確解。在營建工程中,Tommelein (1989), Cheng (1992), Thabet (1992), Tommelein and Zouein (1993), Riley (1994), Lin and Haas (1996), Osman et al. (2003b), and Elbeltagi et al. (2004)使用交互選擇或電腦輔助資源定位等方式探討解決動態設施空間規劃問題的替代方法。
計畫 Methodology
本研究所開發之資源分配及時程規畫系統乃使用模擬及分析技術去模擬PERT中工項時程的不確定性。本系統乃依據各相關資源的生產率及其機率分佈(包括分佈的形狀,均值和方差)計算各工項的時程。此外,本系統引用Ahuja et al.(1995)所介紹的工項關鍵性概念,而非一般常用的路徑關鍵性概念來避免PERT所導致的缺失。
本系統的流程圖如圖一所示,包括:(1)建構各工項網絡關係;(2)執行模擬分析;(3)風險性分析,此流程圖的16個演算步驟詳述如下:
圖一、系統流程圖
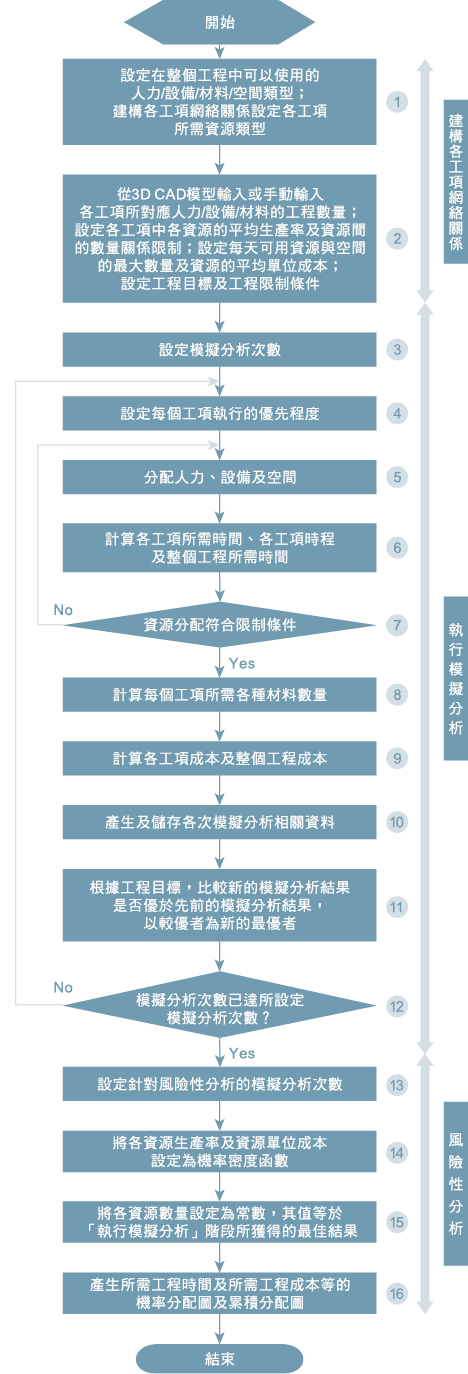
建構各工項網絡關係
- 步驟1:先設定在整個工程中可以使用的人力、設備、材料及空間類型。然後,建構各工項網絡關係,並設定各工項所需資源類型。
- 步驟2:從3D CAD模型輸入或手動輸入各工項所對應人力、設備及材料的工程數量;設定各工項中各資源的平均生產率及資源間的數量關係限制;設定每天可用資源與空間的最大數量及資源的平均單位成本;設定工程目標(如:最低工程成本、最短工期等)及工程限制條件(如:工程完成期限、每天可使用的資源數量限制等)。
執行模擬分析
- 步驟3:設定模擬分析次數
- 步驟4:設定每個工項執行的優先程度。若無特殊考量,可以設定最小值為1,最大值為總工項數目的均勻分佈。
- 步驟5:系統依據每個工項於步驟4所設定的優先程度分配人力、設備及空間。
- 步驟6:系統根據步驟5所分配的人力、設備及空間計算各工項所需時間、各工項時程及整個工程所需時間。
- 步驟7:綜整步驟6之結果,檢查每天各類型資源所分配的總數目是否超過該類型資源每天可用的最大數量,並確認各工項各資源間的數量關係沒有違反原先所設定的限制條件。
- 步驟8:計算每個工項所需各種材料數量。
- 步驟9:計算各工項成本及整個工程成本。
- 步驟10:產生及儲存各次模擬分析相關資料,包括:各工項及整個工程所需時間、各工項及整個工程所需成本、整個工程所需成本現值、所需材料數量、各工項所需各種資源數量、各資源在各工項的預計生產率等。
- 步驟11:根據步驟2所設定工程目標,比較新的模擬分析結果是否優於先前的模擬分析結果,以較優者為新的最優者。
- 步驟12:重複步驟4到步驟12,直至完成步驟3所設定模擬分析次數。
風險性分析
- 步驟13:設定針對風險性分析的模擬分析次數。
- 步驟14:將各資源生產率及資源單位成本設定為機率密度函數。
- 步驟15:將各資源數量設定為常數,其值等於「執行模擬分析」階段所獲得的最佳結果。
- 步驟16:產生所需工程時間及所需工程成本等的機率分配圖及累積分配圖。
工項是本系統於模擬過程中直接處理的基本要素,而營建過程的動態活動則是反映於各工項的細部狀態改變。本系統主要的模擬演算法主要包含兩個階段:
(1)計算各工項的主要資源生產率、各工項的持續時間、各工項的基本成本、各工項的總金額、各工項所需空間,其主要算式如下:
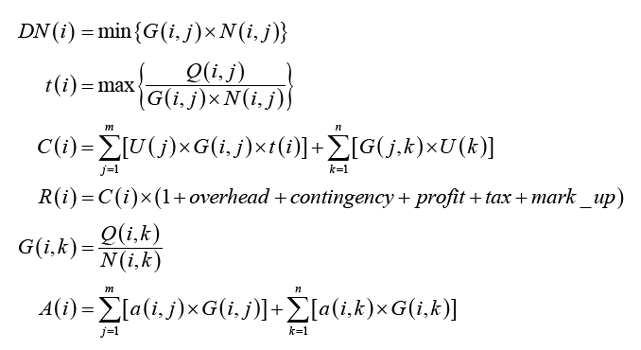
其中 DN(i) = 工項i的主要資源✻生產率
t(i) = 工項i的持續時間
Q(i ,j) =與工項i中的資源✻ j相關的工作數量
Q(i ,k) =與工項i中的材料k相關的工作數量
G(i , j) = 工項i中的資源✻ j數量
G(i , k) =工項i中的材料k數量
N(i, j) = 工項i中的資源✻ j生產率
N(i, k) = 工項i中的單位材料k所生產數量
C(i) = 工項i的基本成本
R(i) = 工項i的總金額
U(j) = 資源✻ j的單位成本
U(k) = 材料k的單位成本
A(i) = 工項i所需總空間
a(i, j) = 工項i中的單位資源✻ j所需空間
a(i, k) = 工項i中的單位材料k所需空間
資源✻= 人力資源或設備
各工項所需人力、設備、材料及空間數量皆於此階段中計算,材料則假設沒有每天能提供最多數量的限制,也不考慮材料運送延遲的問題。G(i , j)是由系統以隨機的均勻分佈方式自動設定,並限定為整數。N(i, j)、N(i, k)、U( j)、U(k)、a(i, j) 及a(i, k)則可以由使用者設定為隨機分佈函數或固定的常數。
(2)安排工項施做順序
在此階段,所有工項的施做順序乃依據他們的邏輯,資源和空間的要求決定。如果某工項符合所有啟動的條件,它就會被選入工項可實行工項的名單中。某工項的最早可施做時間決定於獲得所需資源與空間的時間,及相關前置工項完成時間。可實行工項名單中計算出最早之最早可施做時間者,便會被選定為優先施做工項。
結果與分析 Result
為了讓讀者對本系統有一基本的認識,我們用Talbot and Patterson (1979)所提供資料做範例。
範例一
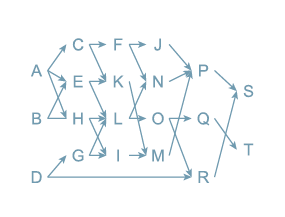
本範例之工項網絡圖如圖二所示,各工項所需時間、各工項所需資源及每天可用資源總數則如表一所示,皆為常數。
|
Activity |
Duration (days) |
Predecessors |
Daily Resource Requirements |
|||||
|---|---|---|---|---|---|---|---|---|
|
R1 |
R2 |
R3 |
R4 |
R5 |
R6 |
|||
|
A |
6 |
- |
5 |
2 |
2 |
2 |
7 |
4 |
|
B |
3 |
- |
3 |
5 |
2 |
3 |
9 |
6 |
|
C |
4 |
A |
2 |
4 |
4 |
2 |
3 |
1 |
|
D |
6 |
- |
5 |
4 |
3 |
5 |
5 |
4 |
|
E |
7 |
A, B |
3 |
5 |
2 |
3 |
8 |
0 |
|
F |
5 |
C |
4 |
1 |
4 |
9 |
2 |
5 |
|
G |
2 |
D |
4 |
1 |
4 |
3 |
9 |
8 |
|
H |
2 |
A, B |
5 |
5 |
4 |
0 |
9 |
1 |
|
I |
2 |
G, H |
3 |
2 |
4 |
3 |
4 |
2 |
|
J |
6 |
F |
1 |
5 |
4 |
6 |
7 |
3 |
|
K |
1 |
C, E |
3 |
3 |
2 |
4 |
5 |
1 |
|
L |
2 |
E, G, H |
3 |
2 |
2 |
8 |
3 |
4 |
|
M |
4 |
I, K |
2 |
2 |
2 |
2 |
4 |
8 |
|
N |
2 |
F, L |
1 |
4 |
4 |
3 |
4 |
1 |
|
O |
3 |
L |
5 |
5 |
4 |
6 |
2 |
3 |
|
P |
5 |
J, M, N |
3 |
2 |
3 |
4 |
7 |
8 |
|
Q |
8 |
O |
4 |
5 |
4 |
2 |
3 |
4 |
|
R |
2 |
D, O |
5 |
3 |
3 |
3 |
7 |
8 |
|
S |
6 |
P, R |
2 |
4 |
6 |
2 |
3 |
4 |
|
T |
2 |
Q |
1 |
6 |
2 |
7 |
5 |
2 |
|
Daily resource limits |
7 |
10 |
10 |
16 |
18 |
13 |
||
為了用本系統與商用軟體Primavera Project Planner及Microsoft Project做性能上的比較,我們用同樣的上述資料做分析。Primavera Project Planner及Microsoft Projec所得到的所需總工程時間皆為49天,用本系統則得到所需總工程時間為45天(如表二所示),約少了8.2%的時間。
|
activity resource \day |
Daily Activities |
Resource Quantity |
||||||||||||||||||||||||
|---|---|---|---|---|---|---|---|---|---|---|---|---|---|---|---|---|---|---|---|---|---|---|---|---|---|---|
|
A |
B |
C |
D |
E |
F |
G |
H |
I |
J |
K |
L |
M |
N |
O |
P |
Q |
R |
S |
T |
R1 |
R2 |
R3 |
R4 |
R5 |
R6 |
|
|
1 |
× |
5 |
2 |
2 |
2 |
7 |
4 |
|||||||||||||||||||
|
2 |
× |
5 |
2 |
2 |
2 |
7 |
4 |
|||||||||||||||||||
|
3 |
× |
5 |
2 |
2 |
2 |
7 |
4 |
|||||||||||||||||||
|
4 |
× |
5 |
2 |
2 |
2 |
7 |
4 |
|||||||||||||||||||
|
5 |
× |
5 |
2 |
2 |
2 |
7 |
4 |
|||||||||||||||||||
|
6 |
× |
5 |
2 |
2 |
2 |
7 |
4 |
|||||||||||||||||||
|
7 |
× |
× |
5 |
9 |
6 |
5 |
12 |
7 |
||||||||||||||||||
|
8 |
× |
× |
5 |
9 |
6 |
5 |
12 |
7 |
||||||||||||||||||
|
9 |
× |
× |
5 |
9 |
6 |
5 |
12 |
7 |
||||||||||||||||||
|
10 |
× |
× |
7 |
8 |
7 |
7 |
8 |
5 |
||||||||||||||||||
|
11 |
× |
5 |
4 |
3 |
5 |
5 |
4 |
|||||||||||||||||||
|
12 |
× |
5 |
4 |
3 |
5 |
5 |
4 |
|||||||||||||||||||
|
13 |
× |
5 |
4 |
3 |
5 |
5 |
4 |
|||||||||||||||||||
|
14 |
× |
5 |
4 |
3 |
5 |
5 |
4 |
|||||||||||||||||||
|
15 |
× |
5 |
4 |
3 |
5 |
5 |
4 |
|||||||||||||||||||
|
16 |
× |
× |
7 |
6 |
6 |
12 |
10 |
5 |
||||||||||||||||||
|
17 |
× |
× |
7 |
6 |
6 |
12 |
10 |
5 |
||||||||||||||||||
|
18 |
× |
× |
7 |
6 |
6 |
12 |
10 |
5 |
||||||||||||||||||
|
19 |
× |
× |
7 |
6 |
6 |
12 |
10 |
5 |
||||||||||||||||||
|
20 |
× |
× |
7 |
6 |
6 |
12 |
10 |
5 |
||||||||||||||||||
|
21 |
× |
× |
7 |
6 |
6 |
6 |
17 |
8 |
||||||||||||||||||
|
22 |
× |
× |
7 |
6 |
6 |
6 |
17 |
8 |
||||||||||||||||||
|
23 |
× |
× |
6 |
10 |
8 |
6 |
16 |
4 |
||||||||||||||||||
|
24 |
× |
× |
6 |
10 |
8 |
6 |
16 |
4 |
||||||||||||||||||
|
25 |
× |
× |
× |
7 |
10 |
10 |
13 |
16 |
6 |
|||||||||||||||||
|
26 |
× |
× |
4 |
7 |
8 |
9 |
11 |
5 |
||||||||||||||||||
|
27 |
× |
× |
4 |
7 |
6 |
14 |
10 |
7 |
||||||||||||||||||
|
28 |
× |
× |
4 |
7 |
6 |
14 |
10 |
7 |
||||||||||||||||||
|
29 |
× |
× |
7 |
7 |
6 |
8 |
6 |
11 |
||||||||||||||||||
|
30 |
× |
× |
7 |
7 |
6 |
8 |
6 |
11 |
||||||||||||||||||
|
31 |
× |
× |
7 |
7 |
6 |
8 |
6 |
11 |
||||||||||||||||||
|
32 |
× |
× |
3 |
6 |
6 |
5 |
8 |
9 |
||||||||||||||||||
|
33 |
× |
× |
6 |
7 |
7 |
6 |
11 |
9 |
||||||||||||||||||
|
34 |
× |
5 |
3 |
3 |
3 |
7 |
8 |
|||||||||||||||||||
|
35 |
× |
× |
7 |
7 |
7 |
6 |
10 |
12 |
||||||||||||||||||
|
36 |
× |
× |
7 |
7 |
7 |
6 |
10 |
12 |
||||||||||||||||||
|
37 |
× |
× |
7 |
7 |
7 |
6 |
10 |
12 |
||||||||||||||||||
|
38 |
× |
× |
7 |
7 |
7 |
6 |
10 |
12 |
||||||||||||||||||
|
39 |
× |
× |
7 |
7 |
7 |
6 |
10 |
12 |
||||||||||||||||||
|
40 |
× |
× |
6 |
9 |
10 |
4 |
6 |
8 |
||||||||||||||||||
|
41 |
× |
× |
6 |
9 |
10 |
4 |
6 |
8 |
||||||||||||||||||
|
42 |
× |
× |
6 |
9 |
10 |
4 |
6 |
8 |
||||||||||||||||||
|
43 |
× |
× |
3 |
10 |
8 |
9 |
8 |
6 |
||||||||||||||||||
|
44 |
× |
× |
3 |
10 |
8 |
9 |
8 |
6 |
||||||||||||||||||
|
45 |
× |
2 |
4 |
6 |
2 |
3 |
4 |
|||||||||||||||||||
範例二
本範例之主要目的為幫助讀者對本系統有進一步瞭解,其基本資料如圖二及表三所示。此外,利率設定為15%,經常費用設定為10%,偶發性費用設定為25%,利潤設定為15%,銷售稅設定為8.25%的,物價通膨設定為17%。
圖二、工項網絡圖
|
Activity |
Prede-cessors |
Manpower or Equipment |
Required Resources (Manpower or Equipment) |
Resource Relationship Constraint |
Working Region |
|---|---|---|---|---|---|
|
A |
- |
1,000 |
R1, R2, R3, R4, R5, R6 |
R1:R2=5:2 |
A1 |
|
B |
- |
2,000 |
R1, R2, R3, R4, R5, R6 |
R3:R4:R5 =2:3:9 |
A1 |
|
C |
A |
3,000 |
R1, R2, R3, R4, R5, R6 |
R2:R5=4:3 |
A2 |
|
D |
- |
4,000 |
R1, R2, R3, R4, R5, R6 |
R2:R4=4:5 |
A2 |
|
E |
A, B |
5,000 |
R1, R2, R3, R4, R5 |
R2:R5=5:8 |
A3 |
|
F |
C |
1,000 |
R1, R2, R3, R4, R5, R6 |
R1:R4=4:9 |
A4 |
|
G |
D |
2,000 |
R1, R2, R3, R4, R5, R6 |
R5:R6=9:8 |
A4 |
|
H |
A, B |
3,000 |
R1, R2, R3, R5, R6 |
R2:R5=5:9 |
A3 |
|
I |
G, H |
4,000 |
R1, R2, R3, R4, R5, R6 |
R3:R4=4:3 |
A6 |
|
J |
F |
5,000 |
R1, R2, R3, R4, R5, R6 |
R4:R5=6:7 |
A6 |
|
K |
C, E |
1,000 |
R1, R2, R3, R4, R5, R6 |
R4:R5=4:5 |
A5 |
|
L |
E, G, H |
2,000 |
R1, R2, R3, R4, R5, R6 |
R1:R4=3:8 |
A5 |
|
M |
I, K |
3,000 |
R1, R2, R3, R4, R5, R6 |
R5:R6=4:8 |
A8 |
|
N |
F, L |
4,000 |
R1, R2, R3, R4, R5, R6 |
R3:R4=4:3 |
A7 |
|
O |
L |
5,000 |
R1, R2, R3, R4, R5, R6 |
R2:R4=5:6 |
A7 |
|
P |
J, M, N |
1,000 |
R1, R2, R3, R4, R5, R6 |
R5:R6=7:8 |
A9 |
|
Q |
O |
2,000 |
R1, R2, R3, R4, R5, R6 |
R1:R2=4:5 |
A8 |
|
R |
D, O |
3,000 |
R1, R2, R3, R4, R5, R6 |
R5:R6=7:8 |
A9 |
|
S |
P, R |
4,000 |
R1, R2, R3, R4, R5, R6 |
R2:R3=4:6 |
A10 |
|
T |
Q |
5,000 |
R1, R2, R3, R4, R5, R6 |
R2:R4=6:7 |
A10 |
|
Item |
Activity |
Resource (Manpower or Equipment) |
|||||
|---|---|---|---|---|---|---|---|
|
R1 |
R2 |
R3 |
R4 |
R5 |
R6 |
||
|
Max Productivity (Q/unit-hr) |
A |
Triang (4,5,6) |
Triang (3,4,5) |
Triang (2,3,4) |
Triang (3,4,5) |
Triang (4,5,6) |
Triang (5,6,7) |
|
B |
Triang (3,4,5) |
Triang (2,3,4) |
Triang (4,5,6) |
Triang (3,4,5) |
Triang (2,3,4) |
Triang (4,5,6) |
|
|
C |
Triang (2,3,4) |
Triang (3,4,5) |
Triang (4,5,6) |
Triang (2,3,4) |
Triang (3,4,5) |
Triang (4,5,6) |
|
|
D |
Triang (4,5,6) |
Triang (3,4,5) |
Triang (2,3,4) |
Triang (3,4,5) |
Triang (4,5,6) |
Triang (5,6,7) |
|
|
E |
Triang (3,4,5) |
Triang (2,3,4) |
Triang (4,5,6) |
Triang (3,4,5) |
Triang (2,3,4) |
- |
|
|
F |
Triang (2,3,4) |
Triang (3,4,5) |
Triang (4,5,6) |
Triang (2,3,4) |
Triang (3,4,5) |
Triang (4,5,6) |
|
|
G |
Triang (4,5,6) |
Triang (3,4,5) |
Triang (2,3,4) |
Triang (3,4,5) |
Triang (4,5,6) |
Triang (5,6,7) |
|
|
H |
Triang (3,4,5) |
Triang (2,3,4) |
Triang (4,5,6) |
- |
Triang (2,3,4) |
Triang (4,5,6) |
|
|
I |
Triang (2,3,4) |
Triang (3,4,5) |
Triang (4,5,6) |
Triang (2,3,4) |
Triang (3,4,5) |
Triang (4,5,6) |
|
|
J |
Triang (4,5,6) |
Triang (3,4,5) |
Triang (2,3,4) |
Triang (3,4,5) |
Triang (4,5,6) |
Triang (5,6,7) |
|
|
K |
Triang (3,4,5) |
Triang (2,3,4) |
Triang (4,5,6) |
Triang (3,4,5) |
Triang (2,3,4) |
Triang (4,5,6) |
|
|
L |
Triang (2,3,4) |
Triang (3,4,5) |
Triang (4,5,6) |
Triang (2,3,4) |
Triang (3,4,5) |
Triang (4,5,6) |
|
|
M |
Triang (4,5,6) |
Triang (3,4,5) |
Triang (2,3,4) |
Triang (3,4,5) |
Triang (4,5,6) |
Triang (5,6,7) |
|
|
N |
Triang (3,4,5) |
Triang (2,3,4) |
Triang (4,5,6) |
Triang (3,4,5) |
Triang (2,3,4) |
Triang (4,5,6) |
|
|
O |
Triang (2,3,4) |
Triang (3,4,5) |
Triang (4,5,6) |
Triang (2,3,4) |
Triang (3,4,5) |
Triang (4,5,6) |
|
|
P |
Triang (4,5,6) |
Triang (3,4,5) |
Triang (2,3,4) |
Triang (3,4,5) |
Triang (4,5,6) |
Triang (5,6,7) |
|
|
Q |
Triang (3,4,5) |
Triang (2,3,4) |
Triang (4,5,6) |
Triang (3,4,5) |
Triang (2,3,4) |
Triang (4,5,6) |
|
|
R |
Triang (2,3,4) |
Triang (3,4,5) |
Triang (4,5,6) |
Triang (2,3,4) |
Triang (3,4,5) |
Triang (4,5,6) |
|
|
S |
Triang (4,5,6) |
Triang (3,4,5) |
Triang (2,3,4) |
Triang (3,4,5) |
Triang (4,5,6) |
Triang (5,6,7) |
|
|
T |
Triang (3,4,5) |
Triang (2,3,4) |
Triang (4,5,6) |
Triang (3,4,5) |
Triang (2,3,4) |
Triang (4,5,6) |
|
|
Unit Cost ($/unit-hr) |
ALL |
Normal (30,3) |
Normal (40,4) |
Normal (50,5) |
Normal (30,3) |
Normal (40,4) |
Normal (50,5) |
|
Daily Resource |
ALL |
7 |
10 |
10 |
16 |
18 |
13 |
|
Req’d Working Area Per Unit |
ALL |
2 |
4 |
6 |
8 |
10 |
12 |
|
Activity |
Work Quantity for Material (Q) |
Material Unit Cost/Material Type Required/ Material Productivity (Q/unit) |
|||||
|---|---|---|---|---|---|---|---|
|
M1 |
M2 |
M3 |
M4 |
M5 |
M6 |
||
|
20($/unit) |
30($/unit) |
40($/unit) |
15($/unit) |
25($/unit) |
35($/unit) |
||
|
A |
5,000 |
800 |
- |
- |
- |
250 |
- |
|
B |
4,000 |
- |
800 |
- |
500 |
- |
- |
|
C |
3,000 |
400 |
- |
250 |
- |
- |
- |
|
D |
2,000 |
- |
- |
400 |
- |
250 |
- |
|
E |
1,000 |
200 |
- |
- |
100 |
- |
- |
|
F |
5,000 |
- |
- |
800 |
- |
500 |
- |
|
G |
4,000 |
- |
- |
- |
800 |
- |
500 |
|
H |
3,000 |
250 |
400 |
- |
- |
- |
- |
|
I |
2,000 |
400 |
- |
250 |
- |
- |
- |
|
J |
1,000 |
- |
200 |
- |
- |
100 |
- |
|
K |
5,000 |
- |
- |
500 |
- |
800 |
- |
|
L |
4,000 |
- |
- |
- |
500 |
- |
800 |
|
M |
3,000 |
- |
250 |
- |
- |
400 |
- |
|
N |
2,000 |
400 |
- |
- |
250 |
- |
- |
|
O |
1,000 |
- |
- |
200 |
- |
- |
100 |
|
P |
5,000 |
500 |
- |
800 |
- |
- |
- |
|
Q |
4,000 |
- |
800 |
- |
500 |
- |
- |
|
R |
3,000 |
400 |
- |
250 |
- |
- |
- |
|
S |
2,000 |
- |
- |
- |
400 |
- |
250 |
|
T |
1,000 |
100 |
- |
- |
- |
200 |
- |
|
Area Name |
A1 |
A2 |
A3 |
A4 |
A5 |
A6 |
A7 |
A8 |
A9 |
A10 |
|---|---|---|---|---|---|---|---|---|---|---|
|
Total Area |
450 |
400 |
400 |
400 |
500 |
400 |
500 |
350 |
350 |
400 |
這個範例的目標是定義為在整個工程工期不超過5000工作小時的前提下,找出最低成本淨現值所對應的各工項資源分配及時程。
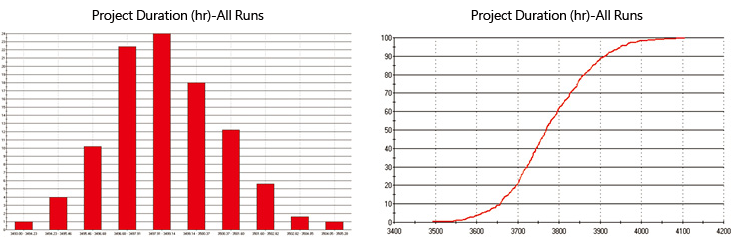
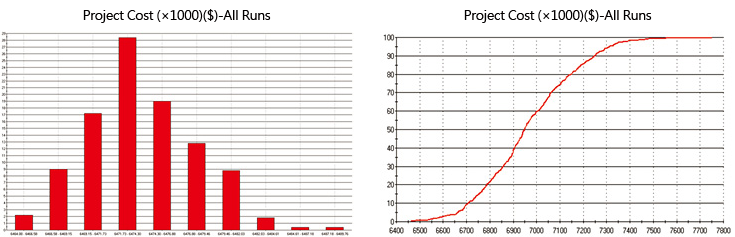
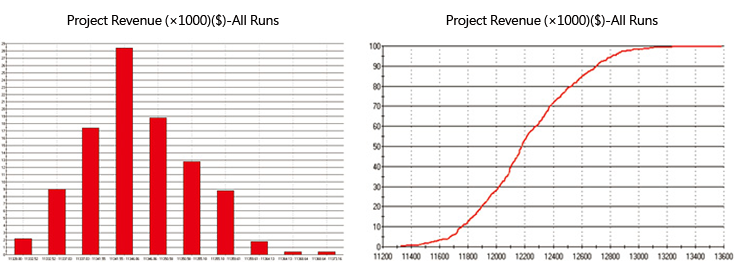
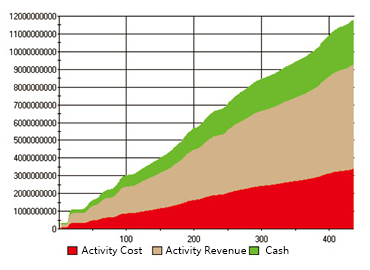
用本系統分析上述資料所得結果如圖三至圖十三及表七至表九所示。從以上資料,我們可以得知所有資源的最大使用率都已經達到100%,表示如果降低每天可以使用資源的最大數量可能會導致工期延長。此外,約有90%的機率,此工程總支出不會超過7,250,000元。
圖三、工程所需時間、基本成本、總金額、成本淨現值

圖四、工程所需時間、基本成本、總金額、成本淨現值的隨機分佈相關資料
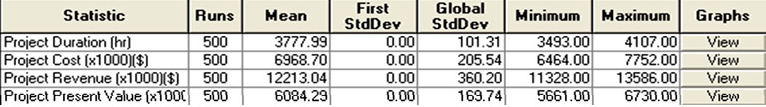
圖五、工程所需時間的隨機分佈機率;圖六、工程所需時間的累計分佈機率
圖七、工程基本成本的隨機分佈機率;圖八、工程基本成本的累計分佈機率
圖九、工程總金額的隨機分佈機率;圖十、工程總金額的累計分佈機率
圖十一、工程啟始時間之成本淨現值的隨機分佈機率;圖十二、工程啟始時間之成本淨現值的累計分佈機率

圖十三、整個工程的現金流量預測
|
Activity Title |
A |
B |
C |
D |
E |
F |
G |
H |
I |
J |
K |
L |
M |
N |
O |
P |
Q |
R |
S |
T |
|
|---|---|---|---|---|---|---|---|---|---|---|---|---|---|---|---|---|---|---|---|---|---|
|
R1 |
Req’d no |
5 |
6 |
5 |
6 |
6 |
4 |
6 |
5 |
7 |
4 |
7 |
6 |
4 |
6 |
7 |
4 |
4 |
7 |
3 |
4 |
|
Productivity |
1.6 |
2 |
4.2 |
5 |
2 |
5 |
2.67 |
2.4 |
3.43 |
4.5 |
3.43 |
2.5 |
5 |
4 |
2.57 |
2.25 |
3 |
3.43 |
5 |
5 |
|
|
R2 |
Req’d no |
2 |
3 |
8 |
8 |
10 |
7 |
4 |
10 |
8 |
6 |
8 |
9 |
10 |
6 |
10 |
8 |
5 |
6 |
4 |
6 |
|
Productivity |
4 |
4 |
2.63 |
3.75 |
1.2 |
2.86 |
4 |
1.2 |
3 |
3 |
3 |
1.67 |
2 |
4 |
1.8 |
1.125 |
2.4 |
4 |
3.75 |
3.33 |
|
|
R3 |
Req’d no |
10 |
4 |
7 |
10 |
4 |
7 |
8 |
4 |
8 |
6 |
8 |
5 |
9 |
8 |
6 |
3 |
8 |
10 |
6 |
8 |
|
Productivity |
0.8 |
3 |
3 |
3 |
3 |
2.86 |
2 |
3 |
3 |
3 |
3 |
3 |
2.22 |
3 |
3 |
3 |
1.5 |
2.4 |
2.5 |
2.5 |
|
|
R4 |
Req’d no |
10 |
6 |
6 |
10 |
15 |
9 |
14 |
- |
6 |
12 |
12 |
16 |
8 |
6 |
12 |
14 |
6 |
10 |
10 |
7 |
|
Productivity |
0.8 |
2 |
3.5 |
3 |
0.8 |
2.22 |
1.14 |
- |
4 |
1.5 |
2 |
0.94 |
2.5 |
4 |
1.5 |
0.64 |
2 |
2.4 |
1.5 |
2.86 |
|
|
R5 |
Req’d no |
2 |
18 |
6 |
6 |
16 |
14 |
9 |
18 |
12 |
14 |
15 |
4 |
4 |
5 |
11 |
7 |
6 |
7 |
16 |
9 |
|
Productivity |
4 |
0.67 |
3.5 |
5 |
0.75 |
1.43 |
1.78 |
0.67 |
2 |
1.29 |
1.6 |
3.75 |
5 |
4.8 |
1.64 |
1.29 |
2 |
3.43 |
0.94 |
2.22 |
|
|
R6 |
Req’d no |
6 |
11 |
5 |
13 |
- |
7 |
8 |
6 |
11 |
7 |
13 |
4 |
8 |
9 |
13 |
8 |
2 |
8 |
4 |
13 |
|
Productivity |
1.33 |
1.09 |
4.2 |
2.31 |
- |
2.86 |
2 |
2 |
2.18 |
2.57 |
1.85 |
3.75 |
2.5 |
2.67 |
1.38 |
1.125 |
6 |
3 |
3.75 |
1.54 |
|
|
M1 |
Req’d no |
6 |
- |
8 |
- |
5 |
- |
- |
12 |
5 |
- |
- |
- |
- |
5 |
- |
10 |
- |
8 |
- |
10 |
|
M2 |
Req’d no |
- |
5 |
- |
- |
- |
- |
- |
8 |
- |
5 |
- |
- |
12 |
- |
- |
- |
5 |
- |
- |
- |
|
M3 |
Req’d no |
- |
- |
12 |
5 |
- |
6 |
- |
- |
8 |
- |
10 |
- |
- |
- |
5 |
6 |
- |
12 |
- |
- |
|
M4 |
Req’d no |
- |
8 |
- |
- |
10 |
- |
5 |
- |
- |
- |
- |
8 |
- |
8 |
- |
- |
8 |
- |
5 |
- |
|
M5 |
Req’d no |
20 |
- |
- |
8 |
- |
10 |
- |
- |
- |
10 |
- |
- |
8 |
- |
- |
- |
- |
- |
- |
5 |
|
M6 |
Req’d no |
- |
- |
- |
- |
- |
- |
8 |
- |
- |
- |
6 |
5 |
- |
- |
10 |
- |
- |
- |
8 |
- |
|
Cost ($) |
176,875 |
325,270 |
213,487 |
292,400 |
779,417 |
97,000 |
240,355 |
442,965 |
357,087 |
536,511 |
106.389 |
217,628 |
266,048 |
275,220 |
656,106 |
188,227 |
206,937 |
241,880 |
451,022 |
495,325 |
|
|
Start Time (hr) |
0.000 |
125.000 |
425.000 |
291.667 |
567.857 |
1359.524 |
1234.524 |
984.524 |
1584.524 |
1751.190 |
1409.524 |
1451.190 |
2473.413 |
2306.746 |
2028.968 |
2915.079 |
2623.413 |
2790.079 |
3276.190 |
3026.190 |
|
|
Finish Time (hr) |
125.000 |
291.667 |
567.857 |
425.000 |
984.524 |
1409.524 |
1359.524 |
1234.524 |
1751.190 |
2028.968 |
1451.190 |
1584.524 |
2623.413 |
2473.413 |
2306.746 |
3026.190 |
2790.079 |
2915.079 |
3542.857 |
3276.190 |
|
|
Duration (hr) |
125.000 |
166.667 |
142.857 |
133.333 |
416.667 |
50.000 |
125.000 |
250.000 |
166.667 |
277.778 |
41.667 |
133.333 |
150.000 |
166.667 |
277.778 |
111.111 |
166.667 |
125.000 |
266.667 |
250.000 |
|
|
Resource |
R1 |
R2 |
R3 |
R4 |
R5 |
R6 |
|---|---|---|---|---|---|---|
|
Mean Resource Utilization Percentage |
74.84% |
71.42% |
65.42% |
59.06% |
60.46% |
55.92% |
|
Maximum Resource Utilization Percentage |
100% |
100% |
100% |
100% |
100% |
100% |
|
Area Name |
A1 |
A2 |
A3 |
A4 |
A5 |
A6 |
A7 |
A8 |
A9 |
A10 |
|---|---|---|---|---|---|---|---|---|---|---|
|
Mean Space Utilization Percentage |
6.23 |
7.21 |
16.22 |
4.62 |
3.38 |
12.24 |
9.82 |
6.45 |
6.48 |
13.25 |
|
Maximum Space Utilization Percentage |
90.67 |
100 |
89 |
93.5 |
99.20 |
98.50 |
90.40 |
86.29 |
98.29 |
95.50 |
結論 Conclusion
如同Hegazy and El-Zamzamy (1998)的研究指出,包含Primavera Project Planner及Microsoft Projec在內的商用軟體,缺乏有效的尋找到資源分配接近最佳化的算法。本研究應用模擬及分析技術,為尋找接近最佳化的資源分配提供另一個選擇。
參考文獻
- Ahuja, H., Dozzi, S. P., and AbouRizk, S. M. (1995). Project management techniques in planning and controlling construction projects. 2nd Ed., Wiley, N.Y.
- Chen, Shih-Ming, Griffis, F.H. (Bud), Chen, Po-Han, Chang, Luh-Maan (July 2011). “Simulation and analytical techniques for construction resource planning and scheduling”. Automation in Construction (In Press, Corrected Proof, Available on line 6 July 2011, SCI/EI).
- Cheng, M.-Y. (1992).“Automated site layout of temporary facilities using geographic information systems (GIS),” PhD dissertation, Civil Engineer-ing Dept., University of Texas, Austin, Tex.
- Cheung, S., Tong, T. K., and Tam, C. (2002). “Site pre-cast yard layout arrangement through genetic algorithms.” Autom. Constr., 11, 35-46.
- Elbeltagi, E., Hegazy, T., and Eldosouky, A. (2004). “Dynamic layout of construction temporary facilities considering safety.”J. Constr. Eng. Manage., 130_4_, 534-541.
- Hamiani, A. (1987).“CONSITE: A knowledge-based expert system framework for construction site layout,”PhD dissertation, Civil Engineering Dept., University of Texas, Austin, Tex.
- Hegazy, T. and El-Zamzamy, H., (1998)“Project Management Software that Meet the Challenge,” Cost Engineering, AACE International, Vol. 4, No. 5, pp.25-33.
- Hegazy, T. (2002).“Computer-based construction project management,”Prentice-Hall, Upper Saddle River, N.J.
- Hegazy, T., and Elbeltagi, E. (1999).“EvoSite: Evolutionary-based model for site layout planning.”J. Comput. Civ. Eng., 13_3_, 198-206.
- Khalafallah, A., and El-Rayes, K. (2005). “Trade-off between safety and cost in planning construction site layouts.”J. Constr. Eng. Manage., 131_11_, 1186-1195.
- Khalafallah, A., and El-Rayes, K. (2006). “Minimizing construction related hazards in airport expansion projects.”J. Constr. Eng. Manage., 132_6_, 562-572.
- Li, H., and Love, P. (1997).“Using improved genetic algorithms to facilitate time-cost optimization.”J. Constr. Eng. Manage., 123(3), 233-237.
- Lin, K.-L., and Haas, C. T. (1996).“An interactive planning environment for critical operations.”J. Constr. Engrg. Mgmt., ASCE, 122(3), 212-222.
- Mawdesley, M. J., Al-jibouri, S. H., and Yang, H. (2002).“Genetic algorithms for construction site layout in project planning.”J. Constr. Eng. Manage., 128_5_, 418-426.
- Montreuil, B., and Venkatadri, U. (1991). “Strategic interpolative design of dynamic manufacturing systems layouts.”Mgmt. Sci., 37(6), 682-693.
- Osman, H., Georgy, M. E., and Ibrahim, M. E. (2003a),“A hybrid CAD based construction site layout planning system using genetic algorithms.”Autom. Constr., 12, 749-764.
- Osman, H., Georgy, M., E., and Ibrahim, M. E. (2003b).“An automated system for dynamic construction site layout planning.”Proc., 10th Int. Colloquium on Structural and Geotechnical Engineering, Ain Shams University, Cairo, Egypt.
- Riley, D. R. (1994).“Modeling the space behavior of construction activities,”PhD dissertation, Dept. of Architectural Engrg., Penn State University, University Park, Pa.
- Rodriguez-Ramos, W. E. (1982).“Quantitative techniques for construction site layout planning,”PhD dissertation, University of Florida, Gainesville, Fla.
- Rosenblatt, M. J. (1986).“The dynamics of plant layout.”Mgmt. Sci., 32(1), 76–86.
- Sawhney, A., Abudayyeh, O., and Chaitavat-puttiporn, T. (1999) Modeling and Analysis of a Concrete Production Plant using Colored Petri Nets. Journal of Computing in Civil Engineering, American Society of Civil Engineers (ASCE), To Appear in July 1999 Issue.
- Smith, D. M. (1987).“An investigation of the space constraint problem in construction planning,”Major Paper, MS, Virginia Polytechnic Institute and State University, Blacksburg, Va.
- Talbot, F., and Patterson, J. (1979).“Optimal methods for scheduling projects under resource constrains.”Proj. Mgmt. Quarterly, Dec., 26-33.
- Tam, C. M., Tong, T. K., and Chan, W. K. W. (2001).“Genetic algorithms for optimizing supply locations around tower crane.”J. Constr. Eng. Manage., 127_4_, 315-321.
- Thabet, W. Y. (1992).“A space-constrained resource-constrained scheduling system for multi-story buildings,”PhD dissertation, Civil Engineering Dept., Virginia Polytechnic Institute and State University, Blacksburg, Va.
- Tommelein, I. D. (1989).“SightPlan-an expert system that models and augments human decision-making for designing construction site lay-outs,”PhD dissertation, Dept. of Civil Engineering, Stanford University, Stanford, Calif.
- Tommelein, I. D. (1991).“Site layout: Where should it go?”Proc., Constr. Congr. 91, ASCE, New York, 632-637.
- Tommelein, I. D., and Zouein, P. P. (1993). “Interactive dynamic layout planning.”J. Constr. Engrg. and Mgmt., ASCE, 119(2), 266-287.
- Warszawski, A., and Peer, S. (1973).“Optimi-zing the location of facilities on a building site.”Operat. Res. Quart., 24(1), 35-44.
- Yeh, I. C. (1995).“Construction-site layout using annealed neural network.”J. Comp. Civ. Engrg., ASCE, 9(3), 201-208.
- Zouein, P. P., Harmanani, H., and Hajar, A. (2002). “Genetic algorithms for solving site layout problem with unequal-size and constrained facilities.”J. Comput. Civ. Eng., 16_2_, 143-151.
留言(0)