摘要
半導體廠房之節約能源策略
Keywords / Energy Saving17,Energy Consumption,Power Soumption,Carbon Footprint2,708,Heat Load,Cda Pressure,Pcw Temperature,708

INTRODUCTION
Energy and resource consumption in the semiconductor industry is causing increased attention since on one hand it increasingly impact the wafer cost due to continuously raising energy prices and on the other hand the energy consumption has an important environmental impact measured by the carbon footprint of the final product.
Also the size of the semiconductor industry attracts attention by regulatory bodies. So Samsung Electronics consumes already 1% of Korea’s overall power consumption [1].
This paper shall show, how semiconductor fabs consume power and resources, and shall identify opportunities how the overall power and resource consumption can be reduced.
Figure 1 shows a typical power consumption distribution by facility system of a 300 mm fab. Data have been taken from multiple sources [2] [3] [4] [5] and been integrated into a tool based equivalent energy consumption model.
Figure 1 : Energy consumption of a semiconductor fab by facility system (300 mm)
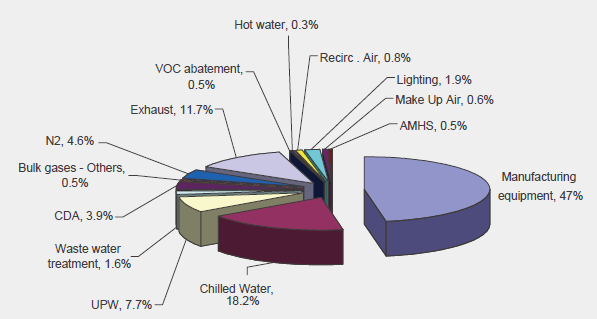
This diagram shows that the largest amount of power is consumed by the equipment, but approx. 55% is consumed by facility systems. Although also this consumption is mainly driven by process requirements, e.g. exhaust, need for cooling, consumption of nitrogen, compressed air and ultrapure water. The energy needed for facility systems can much higher but also lower between 35% and 65% of the total site power consumption.
The variation between fabs depends on climatic and operational conditions:
- Need for cooling and for how long, raw water temperature cooling or use for heat recovery
- Use of natural gas for boiler and local exhaust abatement
- Water management system: chemical purity of raw water, need for high recycling rates due to cost, scarcity or regulations
- Specific process requirements, e.g. quantity and temperature of hot ultrapure water
- Special conditions, e.g. use of river water for cooling.
The diagram gives some ideas where energy can be saved, but it still does not differentiate enough.
ENERGY CONSUMPTION IN A FAB
Abetter model to determine actual energy and resource saving potentials is therefore shown in Figure 2 and 3. This model uses the equ ivalent energy consumption concept according to SEMI S23 [6] (direct and indirect energy consumption) and starts from the use itself in the process and considers the indirect energy consumption by the process utilities, such as UPW, nitrogen, compressed air, exhaust etc, but it can eb applied beyond that for all resource consumption. In a second layer it also considers the energy consumption of the infrastructure systems, such as the cleanroom, the make-up and recirculating air handling systems, the boilers and chillers. It differentiates between the consumption directly in the tool and the consumption of subfab equipment also called by-pack equipment, such as vacuum pumps, local exhaust abatement, chillers, RF generators etc.
Figure 2 : Direct and indirect power consumption in a fab (overview)
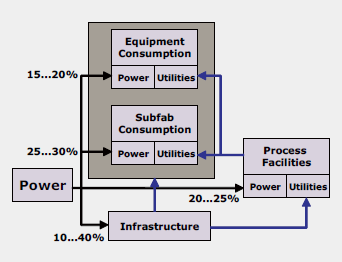
Figure 3 : Direct and indirect power consumption by system
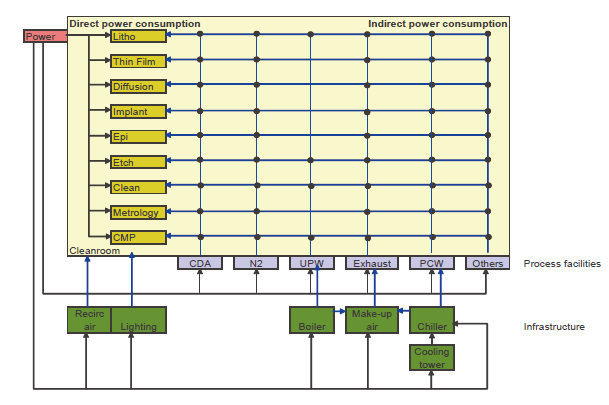 Figure 3 is a more detailed visualization of the relationships
Figure 4 shows a breakdown of the equivalent energy. About 50% is consumed as power, but additional 50% of the equivalent energy is consumed as process utilities. This does not include the natural gas consumption for abatement.
Figure 4 : Equivalent equivalent energy consumption fabwide according to SEMI S23
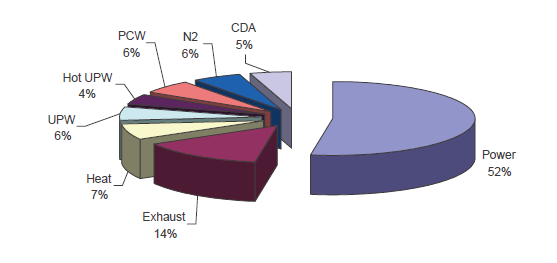 Figure 4 shows the ratio between direct power consumption and the equivalent power consumption of the individual process facilities.
The power and utility consumption was then broken by process area again based on literature data.
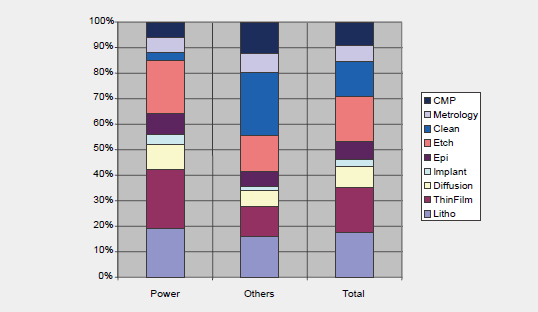
Figure 5 summarizes the results. The first column shows the power consumption of the equipment, the second columns the indirect power consumption, by compressed air, nitrogen, hot and cold ultrapure water, exhaust (incl. required make-up air), heat emitted to te cleanroom and process cooling water incl. the energy needed for the chiller. This indirect energy consumption was converted into power consumption by using the energy conversion factors (ECF) defined in SEMI S23, which are listed in Table 1. The third column shows the total equivalent power as defined by SEMI S23.
Figure 5 : Power & equivalent energy consumption by process area according to SEMI S23
|
|
Unit |
|
ECF |
|---|---|---|---|
|
Power |
kW/ |
kW |
1 |
|
Exhaust |
kWh/ |
m3 |
0.004 |
|
Heat released to the cleanroom |
kW/ |
kW |
0.287 |
|
Ultrapure water (UPW) |
kWh/ |
m3 |
9 |
|
Hot UPW |
kWh/ |
m3 |
92.2 |
|
Process cooling water (PCW) |
kWh/ |
m3 |
0.79 |
|
Nitrogen (N2) |
kWh/ |
m3 |
0.25 |
|
Compressed air (CDA) |
kWh/ |
m3 |
0.147 |
|
High temperature (HT) PCW |
kWh/ |
m3 |
0.26 |
|
House Vacuum |
kWh/ |
m3 |
0.06 |
To identify energy saving potentials another step is required. It needs to be understood, which equipment parts actually consume the energy. The results of a fabwide analysis are shown in Figure 6. It shows as an example the power consumption of a complete fab based on equipment categories. The local exhaust abatement is considered as part of the tool consumption.
Figure 6 : Power consumption of mainframe and subfab components, average over fab. ( calculation assumptions )
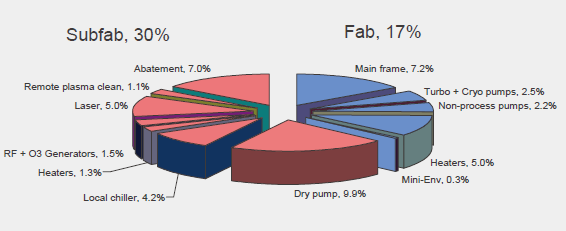
In this case that about one third of the tool power consumption is used by the mainfarme and two thirds by the bypack-equipment in the subfab.
HOW CAN THE ENERGY CONSUMPTION BE REDUCED?
Energy savings can be achieved in three main areas
a. In the facility and infrastructure system
b. In the process itself or
c. At the interface between facility and infrastructuresyszems
1 Improvements in the facility systems
Over years the focus has been on the facility systems since changes are supposed to have no or a lesser impact on process results.
General mechanical systems
The first step was to apply good piping engineering practices, i.e. to find the optimum between operational cost driven by the pressure drop and by the motor/pump/blower/fan efficiency. Success has been reported in many publications. [7] [8] [9]
The investment cost for variable frequency drives reduced over the years and therefore new fabs are using them extensively for pumps, compressors and large fans.
Cleanroom and air handling systems
The energy consumption of the cleanroom depends on many factors:
- Cleanroom class/filter coverage
- Cleanroom concept and associated pressure drop
- Fan efficiency
- Temperature and humidity specifications
300 mm fabs and 200 mm Standard Mechanical Interface (SMIF) fabs have typically much lower filter coverage than traditional fabs. This alone has reduced the power consumption of fabs drastically. Today the power consumption of the recirculation air handling system is hardly higher than the power consumption of the lighting system.
Compressed air and bulk gas systems
Large progress has been made over the years for the compressed air systems. Most manufacturers offer energy saving control systems which are optimizing the operation of the variable frequency drives. Besides that fabs are using more and more turbo compressors compared to oil free screw and similar compressors after smaller turbo units became available.
2 Improvements at the process
Process requirements are driving the overall energy and resource consumption. Naturally the equipment itself is under tight scrutiny. On one hand changes are difficult to implement since they require process re-qualifications on the other hand during process development optimization processes are used to drive down the cost of ownership or cost per layer. Therefore it is mandatory to use energy efficient equipment right from the beginning. Inefficient processes are replaced soon, so electroplating replaced ideas to deposit Copper layers with PVD or CMP replaced other planarization processes. And this is constantly changing and improving.
Equivalent energy consumption fabwide according to SEMI S23
Here is the main application of SEMI S23. It allows the characterization of tools with regard to their overall impact of the energy balance of a fab. Semiconductor companies and equipment suppliers are driving energy savings for manufacturing equipment with aggressive roadmaps. [10] [11]
It needs to be noted, that the technology scaling itself drives energy savings. Assuming that the same product is produced every two to three years the manufacturing output is doubled per wafer. However this is normally not counted in the energy saving roadmaps.
Another way to generate energy savings is the increase of the throughput of equipment. Many facility consumptions, such as exhaust, heating etc. are constant over the time. Therefore an increase in wafer throughput can reduce the specific energy consumption.
Another important driver for energy savings is the reduction of idle consumptions. This can range from optimized lamp configurations in RTP tools to modulating transfer chamber gas flows or UPW by-pass flows in wet equipment.
The reduction of idle consumptions is covered in more detail below.
Energy efficient components
There is a continuous drive to improve component efficiencies. In the last years dry vacuum pumps are improved dramatically with regard to energy reduction. Most pumps allow today to vary speed and nitrogen purge. But also new designs have been introduced which improve pumping efficiency under vacuum conditions without impacting reliability and lifetime of the vacuum pumps.
Solid state chillers have replaced only to a small extent traditionally refrigeration chillers due to high investment cost and availability only for small loads. But also traditional refrigeration chillers are much more efficient then before. They are equipped with variable frequency drives and many other energy saving features.
Resource reduction by tool/chamber matching
Resource consumption matching is one of the basic methods of eco efficiency engineering widely used in the chemical and pharmaceutical industry. Resource consumptions between similar tools and chambers running the same processes shall be equal. In the semiconductor industry this working methods gains more and more attraction. With state-of-the-art software and data mining techniques this can be achieved much more easily then previously. The detailed concept is explained in [12] and [13].
Reduction of idle consumptions
Many resources such as purge or cleaning gases are actually unproductive, but can also pose a certain risk to the process, if not used properly:
- Purge gases prevent the intrusion of particles and oxygen
- Gases such as Helium or mixtures are used to cool down wafers, variations may impact the temperature profile in the reactor/equipment
- Heating to maintain temperature levels in reactors, since variations may cause particle bursts impact layer uniformity
The best known phenomenon is that dry vacuum pumps and abatement are running in a fab all the time independently from the status of the tool. During the idle state of the tool pumps cannot be switched off, but can run at a lower pump speed and with reduced Nitrogen purge rate and a burn/wet exhaust abatement could reduce fuel gas and oxygen.
Fab / subfab synchronization
This concept goes one step further than just using possible idle mode energy and resource reductions. Understanding all process steps enables a full synchronization of the subfab tool operation.
3 Improvements at the interface between process and facility systems
The biggest saving potentials besides the idle mode and fab/subfab synchronization can be found at the interface between facilities and process.
Several examples will be discussed below.
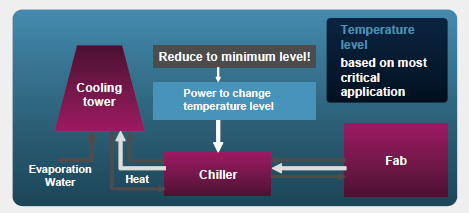
High temperature process cooling water ( HAT PCW )
The basic idea is to allow direct cooling from the cooling tower all year long as illustrated in Figure 7.. Historically the temperature level has been set to the strictest requirements in the fab (dehumidification in litho for environmental chamber). This drove the need for facility chillers to cool down the water. Many applications however can accept higher temperature, on contrary water is partly heated up again. In the meanwhile the needed process cooling water capacity is anyhow so high that a second cooling water loop would be economically viable, especially since the energy costs are continuously increasing.
Figure 7 : Current process cooling water system
This concept has been discussed multiple times [7] [15], but not implemented widely since requires a lot of detailed work.
Since not all users could be switched even if theoretically possible without extensive re-qualification, the idea is to install a second process cooling water system the so-called high temperature process cooling water system HT PCW.
So the current recommendation is to use the HT PCW only on the secondary site of local chillers and for applications where there is no impact on the process to minimize the need for a re-qualification of processes.
Exhaust recycling
Another major opportunity is the reuse of un-contaminated exhaust air. It is more energy effective to cool this air than to extract it to the outside and replace it with fresh make-up air since especially in summer this air needs to be to dehumidified, i.e. to cooled down to less than 10°C, which consumes a lot of energy. Opportunities have been discussed by many authors [9] [16]. TSMC has shown on their website in 2009 the most comprehensive program by using this uncontaminated air as make-up air for gas and chemical rooms.
Others
Other major improvement potentials can be found at interface specifications [7].
A good example can be found for compressed air where air is compressed partly to 10 bar g+, but used at this pressure only for very few applications. Most applications require a pressure regulator, destroying most of the energy, before it can be used.
Other examples are the humidity specification for compressed air or the pressure specification for Nitrogen [7].
The site water consumption is closely related to the energy consumption [17]. High reuse rates require typically energy extensive processes for recycling water treatment. If the consideration is gate-to-gate, i.e. only internal to the fab high recycling rates have a negative impact on equivalent power consumption, and thereby carbon footprint, If the balance area is changed to “cradle to gate” also the power of the raw water treatment and transport is considered and then the result is often changing.
ENERGY SAVING ROADMAP
The purpose of this chapter is to review, whether the energy reduction targets set by the ITRS [19] are realistic. Table 2 shows the targets set by ITRS in 2010 [19] in comparison with the 25% reduction target every year, which most companies follow.
|
|
|
2009 |
2010-2012 |
2013-2015 |
2016-2024 |
|---|---|---|---|---|---|
|
Power Eq/cm2 Si |
kWh/cm2 Si |
0.5 |
0.43 |
0.36 |
0.30...0.25 |
|
Power Total site/cm2 Si |
kWh/cm2 Si |
1 |
0.85 |
0.7 |
0.6...0.5 |
|
Reduction |
25%/5 yr |
2009 |
2012 |
2015 |
2020 |
|
Power Eq/cm2 Si |
kWh/cm2 Si |
0.5 |
0.43 |
0.36 |
0.27 |
|
Power Total site/cm2 Si |
kWh/cm2 Si |
1 |
0.85 |
0.72 |
0.54 |
The question is whether these targets are achievable. Table 3 shows the assumptions about implementation levels of the energy saving proposals explained in the previous chapter for a new 300 mm fab.
|
|
Energy saving measure |
2011 |
2012 |
2013 |
2014 |
2015 |
|
|---|---|---|---|---|---|---|---|
|
Proc. Equipment |
|
|
|
|
|
|
|
|
Dry Pumps |
Idle mode |
25% |
40% |
75% |
100% |
100% |
% of pumps with idle mode |
|
Turbo pumps |
|
5% |
10% |
20% |
30% |
30% |
Efficiency improvement |
|
Heaters |
Efficiency, idle mode |
5% |
10% |
20% |
30% |
30% |
Efficiency improvement |
|
Misc. |
Efficiency |
5% |
10% |
20% |
30% |
30% |
Efficiency improvement |
|
Non-Process Pumps |
Efficiency |
10% |
10% |
20% |
30% |
30% |
Efficiency improvement |
|
RF Generators |
Efficiency improvement |
10% |
10% |
20% |
30% |
30% |
Efficiency improvement |
|
UPS Control |
Efficiency improvement |
10% |
10% |
20% |
30% |
30% |
Efficiency improvement |
|
Remote Plasma Clean |
Idle mode |
10% |
10% |
20% |
30% |
30% |
Efficiency improvement |
|
Mini Environments |
|
|
|
|
|
|
|
|
Others (Local abatement) |
Idle mode |
25% |
40% |
75% |
100% |
100% |
% of abatement with idle mode |
|
Chilled Water |
|
|
|
|
|
|
|
|
Process equipment |
HTPCW |
40% |
50% |
70% |
90% |
90% |
|
|
Others |
|
|
|
|
|
|
|
|
Process Exhaust |
Exhaust recycling |
|
|
|
|
|
Central + local abatement |
|
Scrubbed & general exhaust |
Eco efficiency |
10% |
20% |
30% |
40% |
40% |
Exhaust reduction (e.g. by recycling) |
|
VOC abatement |
Eco efficiency |
5% |
10% |
20% |
30% |
30% |
|
|
Recirculating Air Handing |
Reduce filer coverage |
5% |
5% |
10% |
15% |
15% |
|
|
Lighting |
Efficiency |
5% |
10% |
15% |
15% |
15% |
High efficiency lamps |
|
Make Up Air |
See exhaust |
|
|
|
|
|
|
|
Steam/Hot Water |
|
|
|
|
|
|
|
|
Process Cooling Water |
See HT PCW |
|
|
|
|
|
|
|
DI/UPW |
Eco efficiency |
4% |
6% |
10% |
15% |
20% |
Consumption reduction |
|
UPW Hot |
Eco efficiency |
4% |
6% |
10% |
15% |
20% |
Consumption reduction |
|
Compressed Air |
Eco efficiency |
4% |
6% |
10% |
15% |
20% |
Consumption reduction |
|
Bulk Gases |
Eco efficiency |
4% |
6% |
10% |
15% |
20% |
Consumption reduction |
|
Process Vacuum |
Eco efficiency |
4% |
6% |
8% |
8% |
10% |
Consumption reduction |
|
Industrial Waste Collection & Treatment |
Eco efficiency |
4% |
6% |
10% |
15% |
20% |
Consumption reduction |
|
Chemical Dispense |
Eco efficiency |
4% |
6% |
10% |
15% |
20% |
Consumption reduction |
|
Automated Material Handling System AMHS |
Eco efficiency |
4% |
6% |
10% |
15% |
20% |
Consumption reduction |
Table 4 shows the results of the simulation. It can be clearly seen that the 25% energy saving level is achievable, but requires the implementation of multiple concepts. A single activity alone will not achieve the target.
|
|
300 mm |
Power in kW |
2011 |
2012 |
2013 |
2014 |
2015 |
Delta in kW |
|---|---|---|---|---|---|---|---|---|
|
Proc. Equipment |
47.2% |
11,213 |
10,692 |
10,396 |
9,630 |
8,965 |
8,965 |
2,248 |
|
Dry Pumps |
19.1% |
4,535 |
4,308 |
4,172 |
3,855 |
3,628 |
3,628 |
907 |
|
Turbo pumps |
4.3% |
1,019 |
1,009 |
999 |
978 |
958 |
958 |
61 |
|
Heaters |
5.9% |
1,391 |
1,321 |
1,252 |
1,113 |
974 |
974 |
417 |
|
Misc. |
5.4% |
1,284 |
1,220 |
1,156 |
1,027 |
899 |
899 |
385 |
|
Non-Process Pumps |
4.1% |
963 |
867 |
867 |
770 |
674 |
674 |
289 |
|
RF Generators |
2.7% |
642 |
629 |
629 |
616 |
603 |
603 |
39 |
|
UPS Control |
1.8% |
428 |
419 |
419 |
411 |
402 |
402 |
26 |
|
Remote Plasma Clean |
1.4% |
321 |
315 |
315 |
308 |
302 |
302 |
19 |
|
Mini Environments |
0.5% |
107 |
107 |
107 |
107 |
107 |
107 |
0 |
|
Others (Local abatement) |
2.2% |
523 |
497 |
481 |
445 |
418 |
418 |
105 |
|
Chilled Water |
20.0% |
4,756 |
3,490 |
3,129 |
2,442 |
1,820 |
1,820 |
2,936 |
|
Process equipment |
13.5% |
3,210 |
1,926 |
1,605 |
963 |
321 |
321 |
2,889 |
|
Others |
6.5% |
1,546 |
1,546 |
1,546 |
1,546 |
1,546 |
1,546 |
0 |
|
Process Exhaust |
2.3% |
547 |
520 |
492 |
438 |
383 |
383 |
164 |
|
Scrubbed & general exhaust |
1.9% |
452 |
429 |
407 |
361 |
316 |
316 |
136 |
|
VOC abatement |
0.4% |
95 |
90 |
86 |
76 |
67 |
67 |
29 |
|
Recirculating Air Handing |
4.0% |
951 |
904 |
904 |
856 |
808 |
808 |
143 |
|
Lighting |
2.2% |
523 |
497 |
471 |
445 |
445 |
445 |
78 |
|
Make Up Air |
3.0% |
713 |
713 |
713 |
713 |
713 |
713 |
0 |
|
Steam/Hot Water |
0.3% |
71 |
71 |
71 |
71 |
71 |
71 |
0 |
|
Process Cooling Water |
2.9% |
690 |
690 |
690 |
690 |
690 |
690 |
0 |
|
DI/UPW |
3.1% |
737 |
708 |
693 |
663 |
627 |
590 |
147 |
|
UPW Hot |
0.5% |
119 |
114 |
112 |
107 |
101 |
95 |
24 |
|
Compressed Air |
4.2% |
999 |
959 |
939 |
899 |
849 |
799 |
200 |
|
Bulk Gases |
7.9% |
1,878 |
1,803 |
1,766 |
1,691 |
1,597 |
1,503 |
376 |
|
Process Vacuum |
0.4% |
95 |
91 |
89 |
88 |
88 |
86 |
10 |
|
Industrial Waste Collection & Treatment |
1.6% |
380 |
365 |
358 |
342 |
323 |
304 |
76 |
|
Chemical Dispense |
0.0% |
0 |
0 |
0 |
0 |
0 |
0 |
0 |
|
Automated Material Handling System AMHS |
0.4% |
95 |
91 |
89 |
86 |
81 |
76 |
19 |
|
|
|
|
|
|
|
|
|
|
|
Total |
100.0% |
23,768 |
21,708 |
20,912 |
19,160 |
17,560 |
17,348 |
6,420 |
|
Reduction |
|
100% |
91.3% |
88.0% |
80.6% |
73.9% |
73.0% |
|
|
Power cost reduction in Mio US$ |
|
1.8 |
2.5 |
4.0 |
5.4 |
5.6 |
|
|
Additionally the savings achieved are in the 5 Mio. US$+ range for a 10000 m2 manufacturing area 300 mm fab.
Key activities to achieve the 25% target in 5 years time horizon are:
- Reduction of resource consumption using eco efficiency engineering methods such as eliminating idle flows as much as possible and chamber & equipment matching of idle and operational flows
- Application of smart idle operation of subfab components and fab/subfab synchronization of vacuum pump, heater and local abatement operation
- Heat recovery from any source, such as hot UPW, compressor cooling water and others.
- Exhaust recycling for uncontaminated exhaust, optimization of exhaust segregation
- High temperature process cooling water (free cooling instead of facility chiller) all year long by optimization of process cooling water temperatures. Use of multiple temperature levels.
SUMMARY AND OUTLOOK
The return of investment of the alternatives proposed here are typically in the 2…3 years range for power rates of approx. 0.1 US$/kWh. Not all of them have been implemented widely, but no major obstacles can be seen for new fabs. In existing fabs not all of them can be implemented with reasonable return of investments, but sometimes government funding is available to improve existing fabs.
Savings beyond the current five years horizon will require a lot of effort beyond, what can be foreseen today, such as:
- Implementation of high temperature PCW for all equipment [7]
- Minimized inlet pressure e.g. for N2, CDA, UPW: system pressure at less than 4 bar g [15]
- Reduction of heat load to cleanroom (at the same time use of high temperature process cooling water)
- Use of green chemistries, which reduce required temperatures.
These changes will require major changes in the process equipment themselves and long process development time. Also since the return of investment is not as clear, it will require close cooperation between all stakeholders to make that happen in the future. This is the reason, why the ITRS has marked the expected energy savings in this time horizon as red.
Energy and resource saving will continue to be a major goal for fabs and suppliers in the semiconductor industry, but it requires a lot of cooperation and efforts to ensure, that it will not impact the process results.
參考文獻
- Taeho Kim: The study on efficient energy using of equipment for energy saving, IHTESH, Hsinchu, 2010.
- Michael O’Halloran: Fab Utility Cost Values for Cost of Ownership (COO) Calculations, International SEMATECH, 2002.
- Horst König: Organizational Energy Conservation at Texas Instruments Freising, Semicon Europe, 2005.
- B. Gopalokrishnan, Y. Mardikar, D. Korakakis: Energy Analysis in Semiconductor Manufacturing, Energy Engineering, 107 (2010) 2.
- Phil Naughton: Measurement of Conservation of Energy by Semiconductor Manufacturing Equipment and setting of targets for improvements, 2005 IEEE.
- SEMI S23: Guide for Conservation of Energy, Utilities and Materials Used By Semiconductor Manufacturing Equipment.
- Uehara Teruyoshi: Energy saving at 300mm Fab, Semicon Japan, 2009.
- Sarah Fister Gale, Energy costs drive innovation, Cleanrooms, September 2007.
- Karl Olander, Philip Naughton: Exhaust/Energy Reduction Opportunities, Controlled Environments, 2003.
- Sangsun Ha: Climate Change Programs Samsung Electronics, Semicon Korea, Energy Workshop, 2009
- Norm Armour: Reducing Environmental & Energy Costs: A Equipment Supplier’s Perspective
- Andreas Neuber, Parth Sethia; Eco-Efficient Solutions Reduce Energy, Costs, Semiconductor International, 12/1/2008.
- Parris Hawkins, Andreas Neuber, Krishna Vepa: Reducing Semiconductor Process Tool Resource Usage – Pilot Project Results, ASMC San Francisco, 2010
- Phil Chandler, Paul Fisher, Andreas Neuber: Subfab sync increases energy savings, Solid State Technology, April 2010.
- Mitsuo Igarashi: JEITA Energy Saving Activities for Semiconductor Factory, Semicon Japan, 2007.
- Steve Russo: Implanter Exhaust Savings - Energy/Capital, ISMI Manufacturing Week, 2009.
- TSMC Website, 2009.
- Vyacheslav Libman, Andreas Neuber: Water Conservation Challenges in the Electronics Industry, UPW conference, Austin 2007.
- International Technology Roadmap for Semiconductors, 2010, www.itrs.net.
留言(0)